

Euro area quarterly balance of payments and international investment position: second quarter of 2026
02 October 2026
- Current account surplus at €265 billion (1.6% of euro area GDP) in four quarters to second quarter of 2026, after a €304 billion surplus (1.9% of GDP) a year earlier
- Geographical counterparts: largest bilateral current account surplus vis-à-vis United Kingdom (€252 billion) and largest deficit vis-à-vis China (€184 billion)
- Net international investment position: net assets of €1.94 trillion (12.0% of euro area GDP) at end of second quarter of 2026
Current account
The current account of the euro area recorded a surplus of €265 billion (1.6% of euro area GDP) in the four quarters to the second quarter of 2026, following a €304 billion surplus (1.9% of GDP) a year earlier (Table 1). This decrease was mainly driven by a lower surplus for goods (from €318 billion to €288 billion) and by a wider deficit for secondary income (from €172 billion to €199 billion). These developments were partly offset by a higher surplus for primary income (from €8 billion to €26 billion), while the surplus for services remained stable at €150 billion.
Estimates on goods trade broken down by product group show that in the four quarters to the second quarter of 2026, the decrease in the goods surplus was mainly due to smaller surpluses for chemical products (from €306 billion to €252 billion) and machinery and manufactured products (from €228 billion to €217 billion). These developments were partly offset by a smaller deficit for energy products (from €256 billion to €236 billion), despite an increase in the deficit in the second quarter of 2026 compared to the same quarter one year ago (from €59 billion to €76 billion).
The stable surplus for services in the four quarters to the second quarter of 2026 reflected widening surpluses for telecommunication, computer and information services (from €229 billion to €247 billion) and travel (from €61 billion to €75 billion), which were partly offset by a larger deficit for charges for the use of intellectual property (from €128 billion to €155 billion).
The increase in the surplus for primary income in the four quarters to the second quarter of 2026 was mainly due to a larger surplus for other investment (from €12 billion to €29 billion) and a larger surplus for direct investment (from €53 billion to €59 billion). These developments were partly offset by a larger deficit for portfolio equity (from €209 billion to €215 billion).
Table 1
Current account of the euro area
(EUR billions, unless otherwise indicated; transactions during the period; non-working day and non-seasonally adjusted)

Source: ECB.
Notes: "Equity" comprises equity and investment fund shares. Goods by product group are estimated using granular data from international trade in goods statistics (provided by Eurostat) based on the standard international trade classification. Discrepancies between totals and their components may arise from rounding.
Data on the geographical counterparts of the euro area current account (Chart 1) show that in the four quarters to the second quarter of 2026, the euro area recorded its largest bilateral surpluses vis-à-vis the United Kingdom (€252 billion, up from €224 billion a year earlier) and Switzerland (€79 billion, down from €94 billion a year earlier). The euro area also recorded surpluses vis-à-vis other emerging economies (€144 billion, down from €149 billion a year earlier), other advanced economies (€119 billion, up from €102 billion a year earlier) and offshore centres (€44 billion, up from €27 billion a year earlier). The largest bilateral deficits were recorded vis-à-vis China (€184 billion, up from €145 billion a year earlier) and United States (€119 billion, up from €54 billion a year earlier). The euro area also recorded a deficit vis-à-vis the residual group of other countries (€81 billion, down from €101 billion a year earlier).
The most significant changes in the current account components by geographical counterpart in the four quarters to the second quarter of 2026 relative to the previous year were as follows: In goods, the surplus vis-à-vis United States decreased from €230 billion to €171 billion, while the surplus vis-à-vis Switzerland increased from €13 billion to €33 billion. In services, the deficit vis-à-vis United States increased from €181 billion to €204 billion, while the balance vis-à-vis offshore centres shifted from a deficit (€4 billion) to a surplus (€16 billion). In primary income, the deficit vis-à-vis United States decreased from €103 billion to €87 billion, while the balance vis-à-vis Switzerland shifted from a surplus (€31 billion) to a deficit (€3 billion). In secondary income, the deficit vis-à-vis EU Member States and EU institutions outside the euro area increased from €77 billion to €98 billion.
Chart 1
Geographical breakdown of the euro area current account balance
(four-quarter moving sums in EUR billions; non-seasonally adjusted)

Source: ECB.
Notes: "EU non-EA" comprises the non-euro area EU Member States and those EU institutions and bodies that are considered for statistical purposes as being outside the euro area, such as the European Commission and the European Investment Bank. "Other advanced" includes Australia, Canada, Japan, Norway and South Korea. "Other emerging" includes Argentina, Brazil, India, Indonesia, Mexico, Saudi Arabia, South Africa and Türkiye. "Other countries" includes all countries and country groups not shown in the chart, as well as unallocated transactions.
International investment position
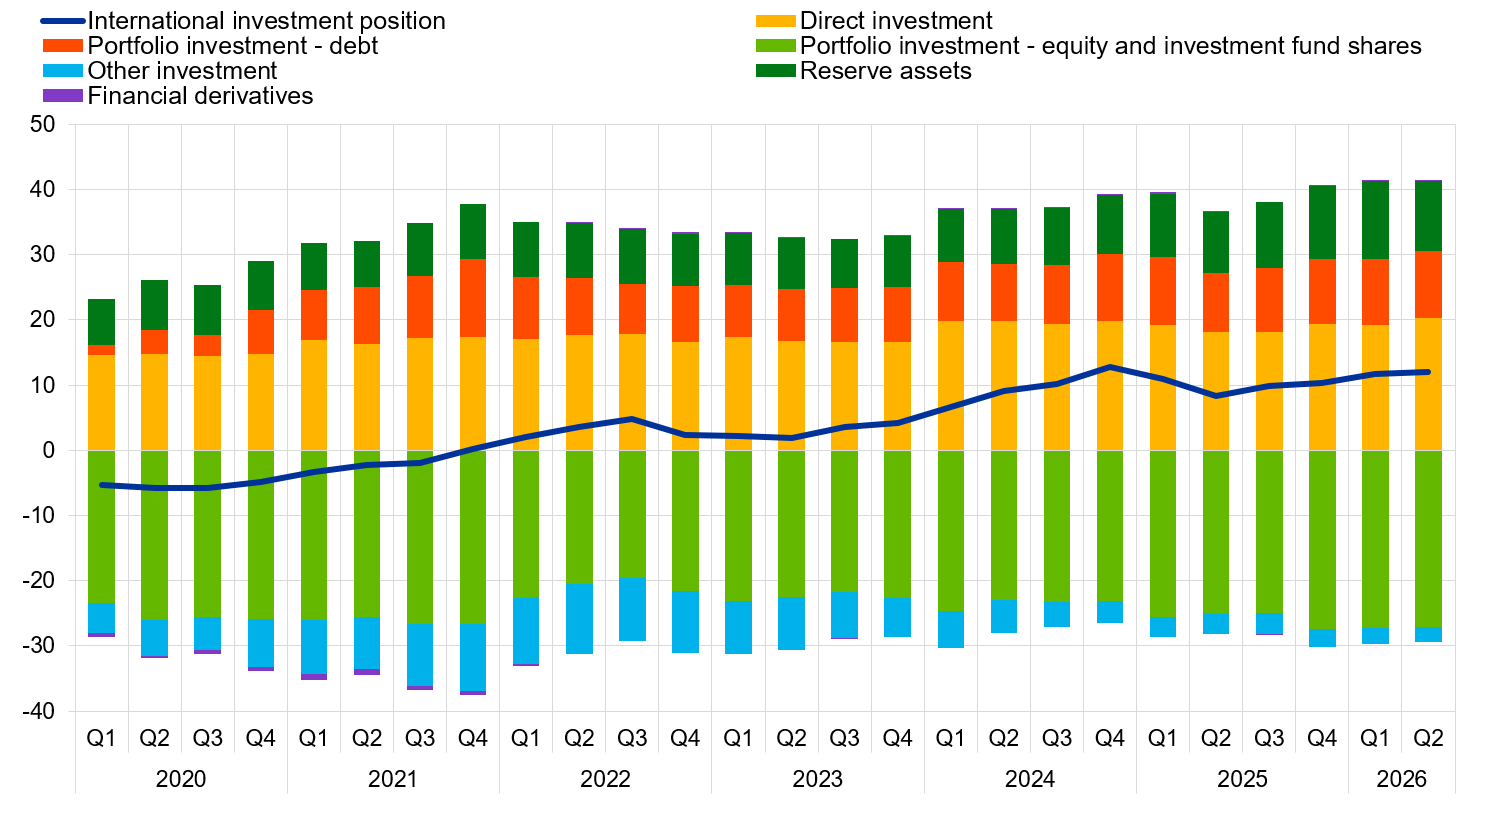
At the end of the second quarter of 2026, the international investment position of the euro area recorded net assets of €1.94 trillion vis-a-vis the rest of the world (12.0% of euro area GDP), up from €1.89 trillion net assets in the previous quarter (Chart 2 and Table 2).
Chart 2
Net international investment position of the euro area
(net amounts outstanding at the end of the period as a percentage of four-quarter moving sums of GDP)
Source: ECB.
The €59 billion increase in net assets was mainly driven by larger net assets in direct investment (up from €3.08 trillion to €3.29 trillion) and lower net liabilities in other investment (down from €0.40 trillion to €0.37 trillion). These developments were partly offset by lower reserve assets (down from €1.91 trillion to €1.76 trillion).
Table 2
International investment position of the euro area
(EUR billions, unless otherwise indicated; amounts outstanding at the end of the period, flows during the period; non-working day and non-seasonally adjusted)

Source: ECB.
Notes: "Equity" comprises equity and investment fund shares. Net financial derivatives are reported under assets. "Other volume changes" mainly reflect reclassifications and data enhancements. Discrepancies between totals and their components may arise from rounding.
The developments in the euro area net international investment position in the second quarter of 2026 were driven mainly by positive transactions (€79 billion), positive exchange rate changes (€74 billion) and positive other volume changes (€72 billion), which were partly offset by negative price changes (€165 billion) (Table 2 and Chart 3).
At the end of the second quarter of 2026, direct investment assets of special purpose entities (SPEs) amounted to €3.45 trillion (26% of total euro area direct investment assets), down from €3.48 trillion at the end of the previous quarter (Table 2). Over the same period, direct investment liabilities of SPEs decreased from €3.18 trillion to €3.17 trillion (32% of total direct investment liabilities).
Gross external debt of the euro area amounted to €18.05 trillion (111% of euro area GDP) at the end of the second quarter of 2026, up by €598 billion compared with the previous quarter.
Chart 3
Changes in the net international investment position of the euro area
(EUR billions; flows during the period; non-working day and non-seasonally adjusted)

Source: ECB.
Note: "Other volume changes" mainly reflect reclassifications and data enhancements.
Data revisions
This statistical release incorporates revisions to the data for the reference periods between the first quarter of 2022 and the first quarter of 2026. The revisions reflect revised national contributions to the euro area aggregates because of the incorporation of newly available information. These revisions did not significantly alter the figures previously published.
Next releases:
- Monthly balance of payments: 20 October 2026 (reference data up to August 2026)
- Quarterly balance of payments and international investment position: 12 January 2027 (reference data up to third quarter of 2026)[1]
For queries, please use the Statistical information request form
Notes
- Data are neither seasonally nor working day-adjusted. Ratios to GDP (including in the charts) refer to four-quarter sums of non-seasonally and non-working day-adjusted GDP figures.
- Hyperlinks in this press release lead to data that may change with subsequent releases as a result of revisions.
Legal Disclaimer:
EIN Presswire provides this news content "as is" without warranty of any kind. We do not accept any responsibility or liability for the accuracy, content, images, videos, licenses, completeness, legality, or reliability of the information contained in this article. If you have any complaints or copyright issues related to this article, kindly contact the author above.
